2026 · Remote staffing company · Dashboard design
Four audit views became one clear dashboard
Four fragmented audit views became one clearer dashboard for reviewing coaching quality, team engagement, and where support was needed.
4 separate views
Before
1 shared overview
After
Patterns + coaching needs
Review focus
Before → After
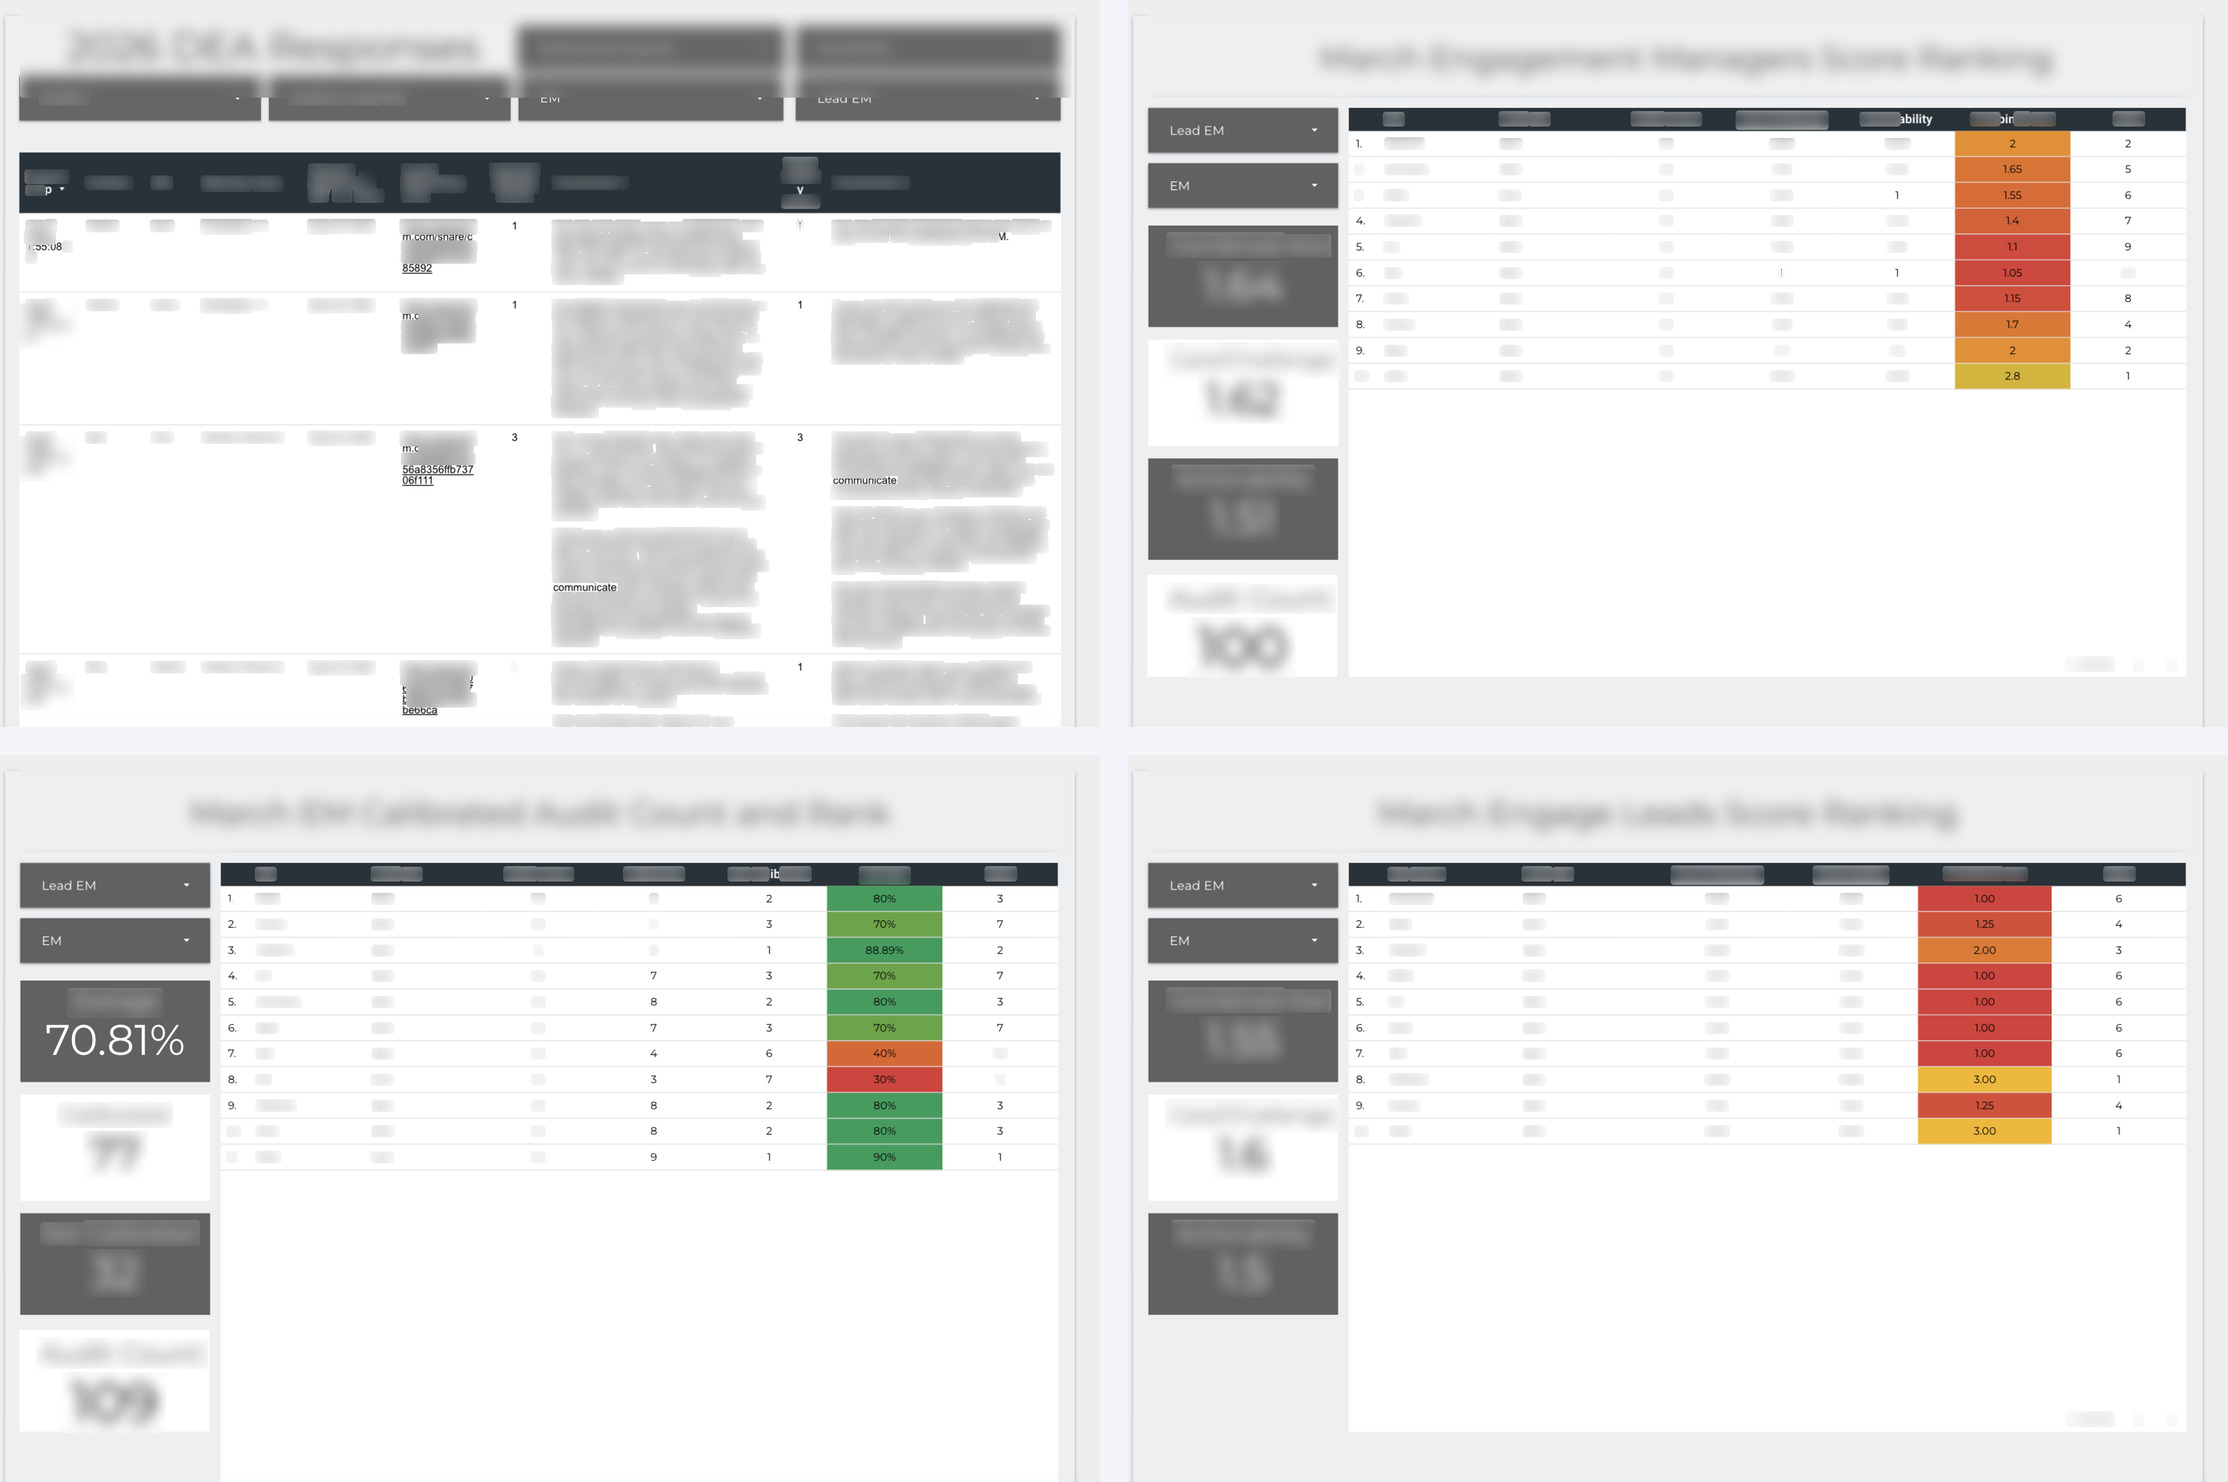
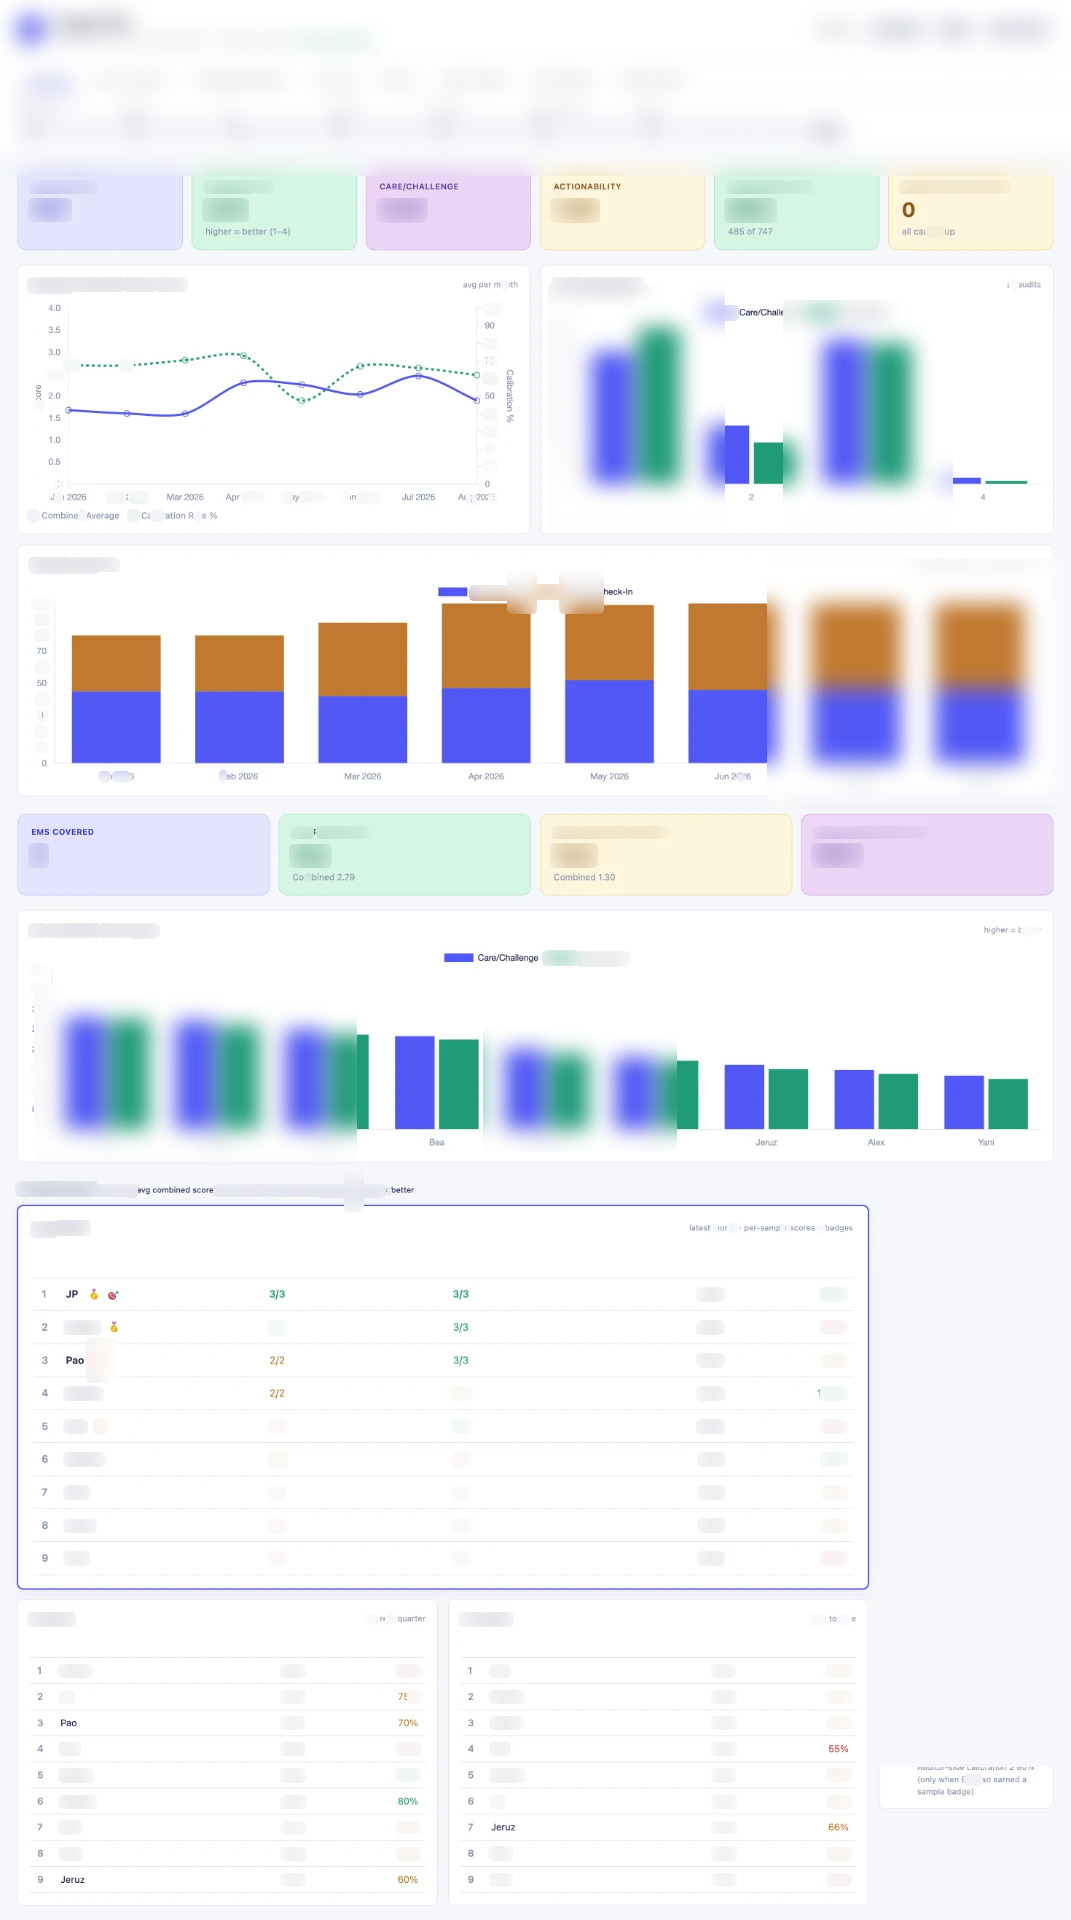
Scroll inside each frame to walk through the full page.
Context
A services team used recurring audits to understand coaching quality and team engagement. The information was valuable, but it lived across several separate monthly views built for individual checks rather than a complete review.
Problem
Reviewers had to move between dense tables to compare audit completion, coaching signals, engagement patterns, and team performance. The separate views made it harder to spot trends and decide where coaching attention was needed.
My role
Redesigned the audit reporting into one dashboard.
Build
- Consolidated the key audit signals into one overview instead of four separate review screens.
- Added filters so reviewers could narrow the dashboard by period, team, reviewer, meeting type, and status.
- Created summary indicators for audit volume, combined quality signals, follow-through, and review completion.
- Added trend and distribution views to make patterns easier to compare over time.
- Brought team-level comparisons and coaching-need visibility into the same review surface.
- Structured the dashboard so the most useful signals appear before the detailed tables.
Built with: Dashboard design · Audit operations · Data visualization · Reporting
Takeaway
A reporting dashboard becomes useful when it does more than store scores. The real value is helping a reviewer see patterns, compare teams, and know where to focus the next coaching conversation.
References available on request.
Have a similar problem?
Request a callNext case
12 hrs/week
40+ client accounts, one place to see them